Guides
Market Overview
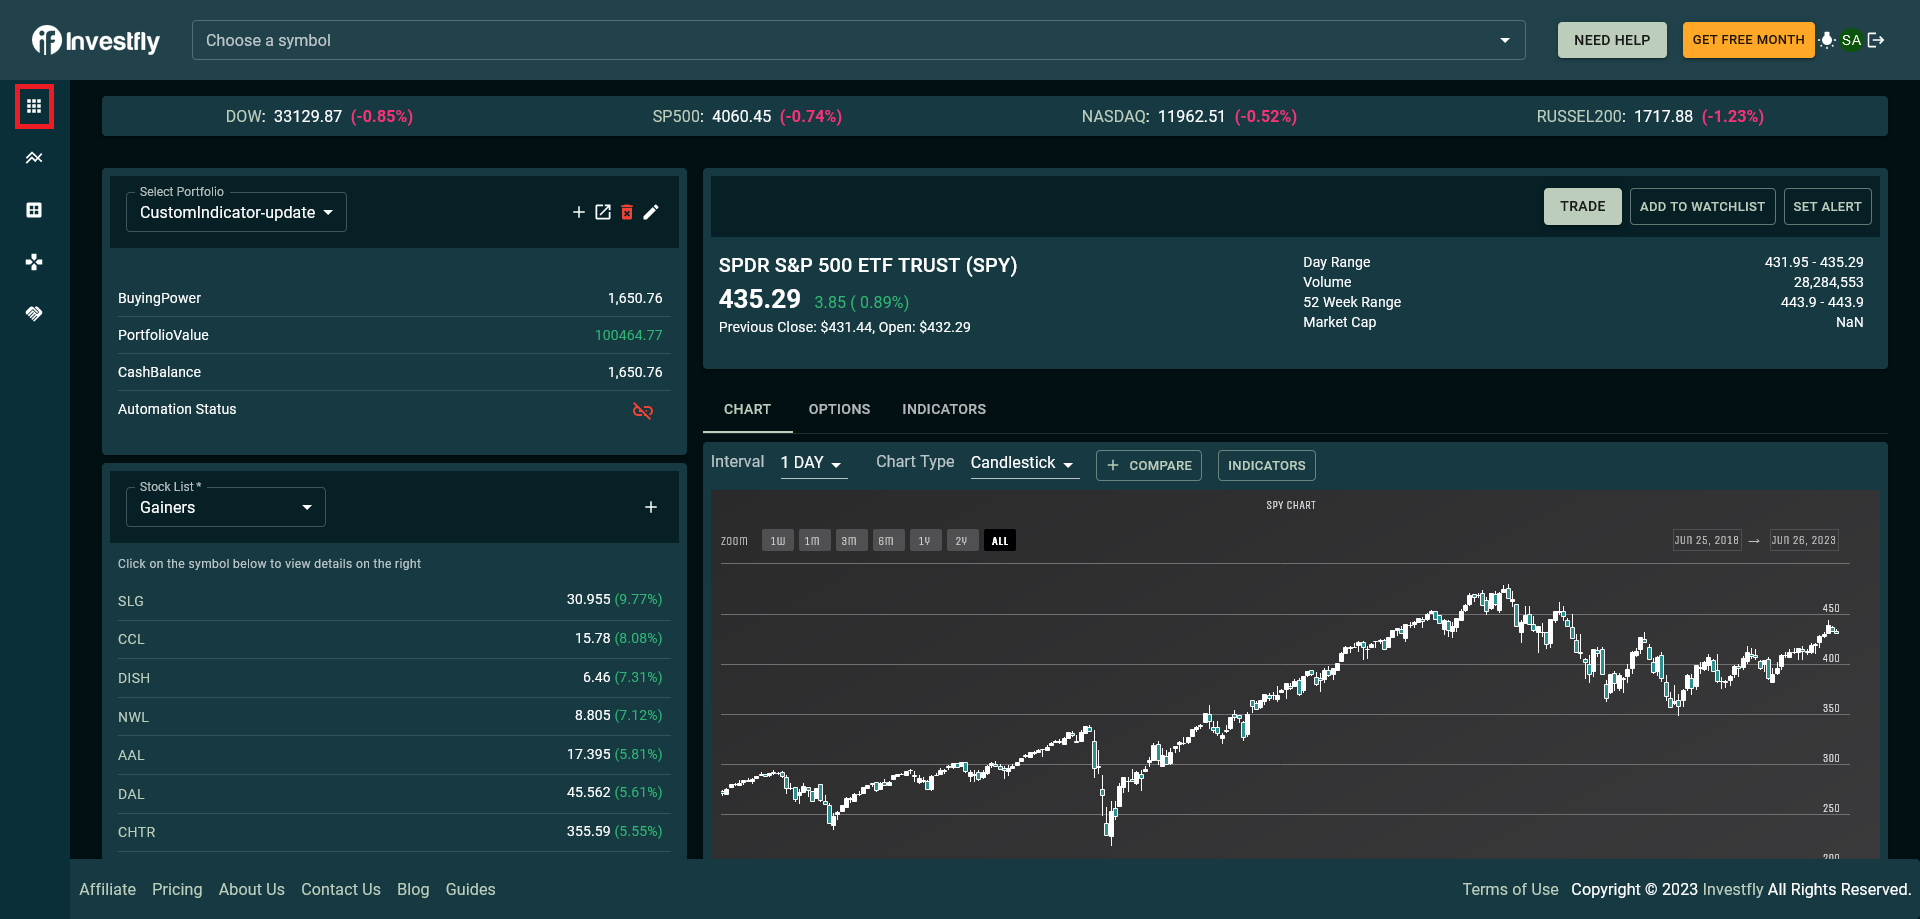
The Market Overview dashboard provides a comprehensive view of market activity to help inform your algorithmic trading decisions.
Our automated trading platform's Market Overview is designed to give you a snapshot of what's happening across different market segments, indices, and sectors. This information is crucial for identifying market trends and potential trading opportunities for your algorithmic trading strategies.
Accessing the Market Overview
To access the Market Overview dashboard:
- Log in to your Investfly account
- Click on Markets in the main navigation menu
- The Market Overview dashboard will be displayed by default
Key Features of the Market Overview
Market Indices
Track the performance of major market indices including:
- S&P 500
- Dow Jones Industrial Average
- NASDAQ Composite
- Russell 2000
- International indices
Sector Performance
View the performance of different market sectors:
- Technology
- Healthcare
- Financial
- Energy
- And more...
Market Movers
Identify stocks with significant price movements:
- Top gainers
- Top losers
- Most active stocks by volume
- Unusual volume activity
Market Breadth Indicators
Analyze overall market health with indicators like:
- Advance/decline ratio
- New highs vs. new lows
- Volume trends
- Market volatility measures
Customizing Your Market Overview
You can personalize the Market Overview dashboard to focus on the information most relevant to your algorithmic trading strategies:
Widget Management
- Click the gear icon in the upper right corner of any widget
- Select Edit to modify the widget's settings
- Select Minimize to collapse the widget
- Select Close to remove the widget from your dashboard
Adding Widgets
- Click the + button in the upper right corner of the dashboard
- Select from the available widget types
- Configure the widget settings as desired
- Click Add Widget to place it on your dashboard
Rearranging Widgets
You can drag and drop widgets to rearrange their positions on your dashboard:
- Hover over the widget header until the cursor changes to a move icon
- Click and hold to drag the widget to a new position
- Release to drop the widget in its new location
Using Market Overview for Algorithmic Trading
The Market Overview dashboard can be a valuable tool for your automated trading strategies:
Market Analysis
Use the Market Overview to assess:
- Overall market direction and sentiment
- Relative strength of different sectors
- Correlation between market indices
- Market volatility and risk levels
Strategy Inputs
Incorporate market data into your algorithmic trading strategies:
- Use sector performance to filter stock selections
- Adjust strategy parameters based on market volatility
- Identify market regimes for strategy switching
- Set position sizing based on market conditions
For more information on how to incorporate market data into your algorithmic trading strategies, see our guides on Creating Trading Strategies and Automation Concepts.
Market Overview Data Sources
The data displayed in the Market Overview dashboard comes from various reliable sources:
- Real-time Market Data: Direct feeds from major exchanges (delayed by 15 minutes for free accounts, real-time for premium subscribers)
- Historical Data: Comprehensive database of historical prices and volumes for accurate trend analysis
- Economic Indicators: Latest economic reports and releases from government and private sources
- News Feed: Curated financial news from reputable providers to help you stay informed about market events
All data is regularly updated to ensure you have the most current information for your algorithmic trading decisions.