Guides
Stock Screener
The Stock Screener is a powerful tool that helps you discover trading opportunities based on custom criteria for your algorithmic trading strategies.
Our automated trading platform's Stock Screener allows you to filter the universe of available stocks based on specific technical, fundamental, and custom criteria. This helps you identify potential candidates for your algorithmic trading strategies that match your investment thesis.
Accessing the Stock Screener
To access the Stock Screener:
- Log in to your Investfly account
- Click on Markets in the main navigation menu
- Select Stock Screener from the dropdown menu
Using the Stock Screener
Filter Categories
The Stock Screener provides various categories of filters to help you narrow down your search:
Price & Volume
- Price range
- Daily trading volume
- Average volume
- Market capitalization
- 52-week highs and lows
Technical Indicators
- Moving averages (multiple timeframes)
- RSI (Relative Strength Index)
- MACD (Moving Average Convergence Divergence)
- Bollinger Bands
- Stochastic Oscillator
Fundamental Data
- P/E Ratio (Price to Earnings)
- EPS (Earnings Per Share)
- Dividend yield
- Revenue growth
- Profit margins
Pattern Recognition
- Candlestick patterns
- Chart patterns (head and shoulders, triangles, etc.)
- Support and resistance breakouts
- Gap ups and gap downs
Setting Up Screening Criteria
To set up your screening criteria:
- Navigate to the Stock Screener interface
- Select the filter category you want to use (Price & Volume, Technical Indicators, etc.)
- Choose specific filters and set their parameters
- For example, set "Price" filter to "Between $10 and $50"
- Or set "RSI(14)" filter to "Less than 30" to find potentially oversold stocks
- Add additional filters as needed by clicking the Add Filter button
- Click Apply Filters to run your screen
Advanced Filtering with Custom Expressions
For more sophisticated screening, you can use custom expressions:
- Click Add Custom Filter button
- Use the Expression Builder to create complex conditions
- For example:
Close > EMA(20) AND Volume > 1.5 * AVG_VOLUME(30)
- For example:
- Click Save Expression to add it to your filters
See our Expression Builder guide for more details on creating custom expressions.
Viewing and Managing Results
Results Table
After applying your filters, the matching stocks will be displayed in a table with the following features:
- Customizable Columns: Choose which data points to display by clicking the column selector icon
- Sorting: Click on any column header to sort results by that criteria
- Real-time Updates: Data updates automatically at regular intervals (premium feature)
Actions on Results
From the results table, you can perform several actions:
- View Stock Details: Click on a stock symbol to open its detailed view
- Add to Watchlist: Select stocks and add them to an existing or new watchlist
- Execute Trades: Premium users can submit orders directly from the screener
- Export Results: Download the current screener results as CSV or Excel file
Saving and Loading Screeners
Saving Your Screener
To save your current screening criteria for future use:
- Set up your desired filters
- Click the Save button in the screener toolbar
- Enter a name for your screener
- Optionally, add a description to remember the screener's purpose
- Click Save Screener
Loading Saved Screeners
To load a previously saved screener:
- Click the Load button in the screener toolbar
- Select from your list of saved screeners
- Click Load to apply the saved filters
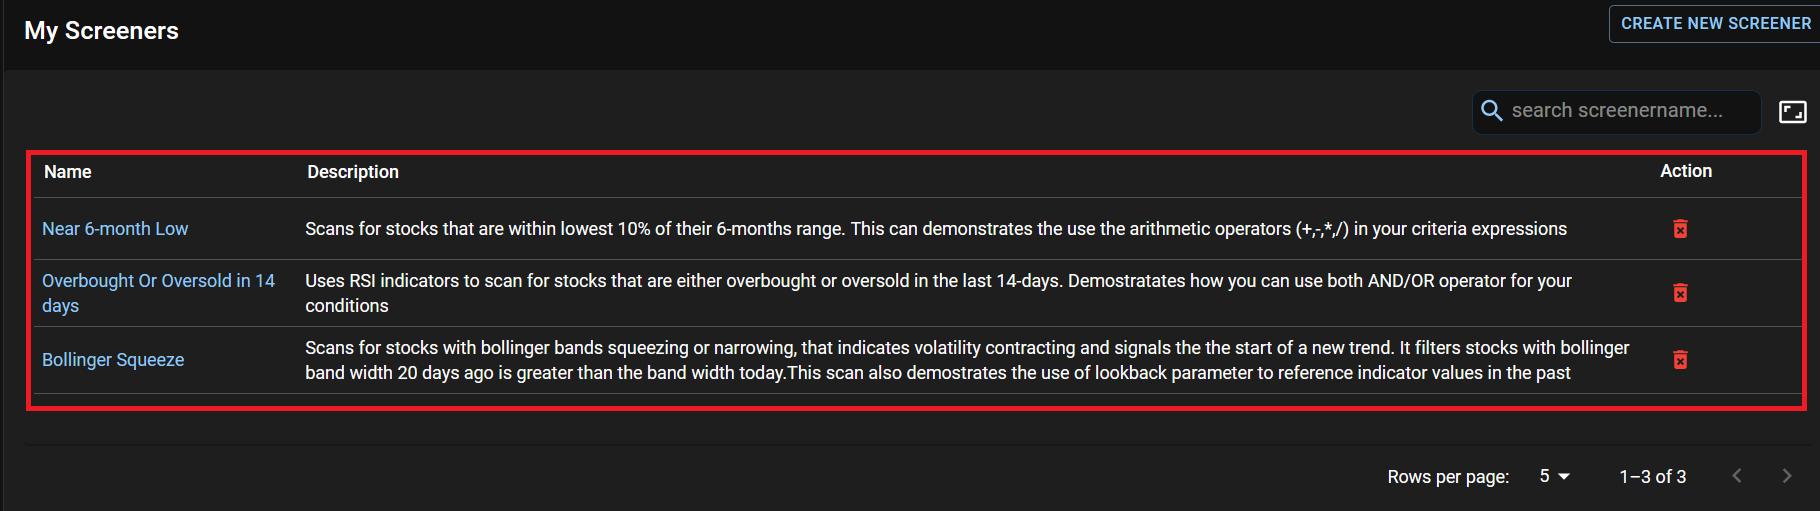
Preset Screeners
Investfly provides several preset screeners for common strategies:
- Momentum Stocks: Identifies stocks with strong upward price movement
- Value Opportunities: Finds potentially undervalued stocks based on fundamentals
- Trend Followers: Shows stocks in established trends with good volume
- Oversold Bounces: Locates stocks that may be ready for a reversal after being oversold
- Earnings Surprises: Highlights stocks that recently beat earnings expectations
To use a preset screener, select it from the Presets dropdown in the screener toolbar.
Using the Stock Screener with Algorithmic Trading
The Stock Screener is a powerful tool for enhancing your algorithmic trading strategies:
Strategy Development
Use the screener to:
- Test trading hypotheses by creating screens that match your strategy conditions
- Analyze historical performance of stocks matching your criteria
- Refine your strategy parameters based on screener results
Automating Screeners
For premium users:
- Schedule screeners to run automatically at specified intervals
- Set up alerts when stocks enter or exit your screener results
- Connect screener results directly to your automated trading strategies
- Use API access to integrate screener functionality with external tools
For more information on incorporating the Stock Screener into your algorithmic trading workflow, see our guides on Creating Trading Strategies and Working with Automated Strategies.